
Odd lots have become both more popular and more pervasive. They’re a point of discussion in the retail world, and the institutional world is examining them on the regulatory front. In this blog post, we investigate the increase in odd lot trading, attempt to isolate the source of growth and quantify the impact.
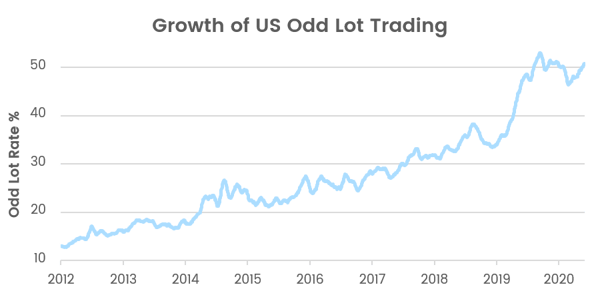
Since 2012, the market has seen a steady, prolonged and, at times, pronounced increase in the rate of odd lot trades as a percentage of overall trades (Odd Lot Rate %). A significant uptick in early 2019 has held reasonably steady into this year.
Although the rate of odd-lot trading is growing, it remains a small component of overall trading volume (Odd Lot Volume %). Throughout 2020, odd lots consistently represented around 12% of the overall market volume. While it’s not a huge number, it’s relevant enough that the SEC ruled to add odd lots to the SIP as part of core data.

Venues and Odd Lot Trading
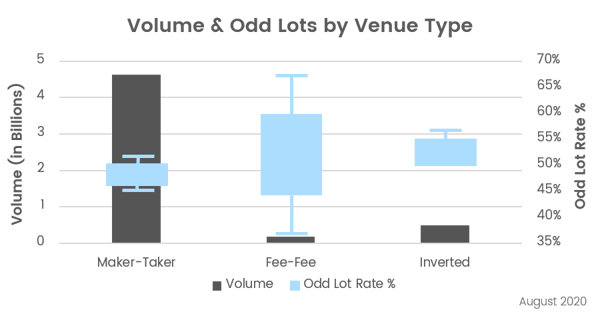
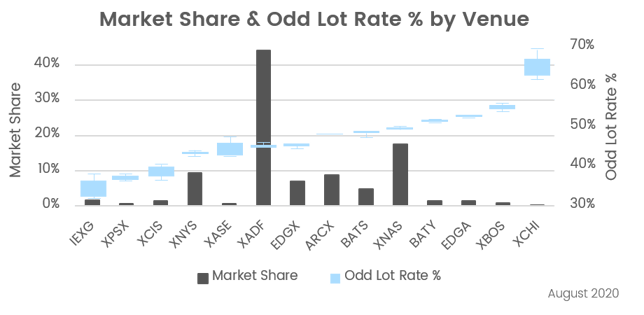
There are notable differences in odd lot trading across venues. The charts below show venue type and market center overlaid with volume/market share.
When comparing venue types, we see a median odd lot rate of 45 – 55%. The most considerable skew is the fee-fee venue type, which is likely due to low volume.
The distribution of odd lots is comparable when analyzing individual venues. Most venues, again, show a rate of 45 – 55%, with no apparent correlation between market share and odd lots rates.
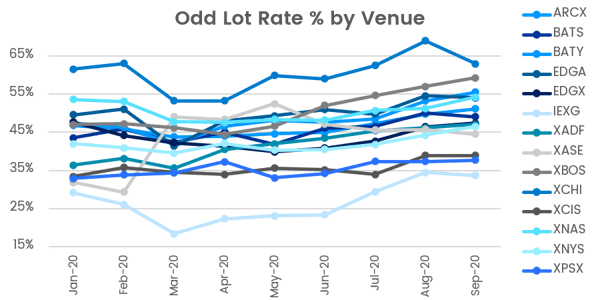
Odd lots are not limited to any one type of venue, and the rate of odd lots across each venue in 2020 held relatively stable, with a gradual increase. Two outliers include IEX (IEXG), which has a significantly lower percentage of odd lots, and NYSE Chicago (XCHI), which prints sub 100 share trades around 60% of the time. Interestingly, March 2020 reported a surge in retail trading, yet odd lot trading rates dipped almost universally (with one anomaly at XASE).
Retail and Odd Lots
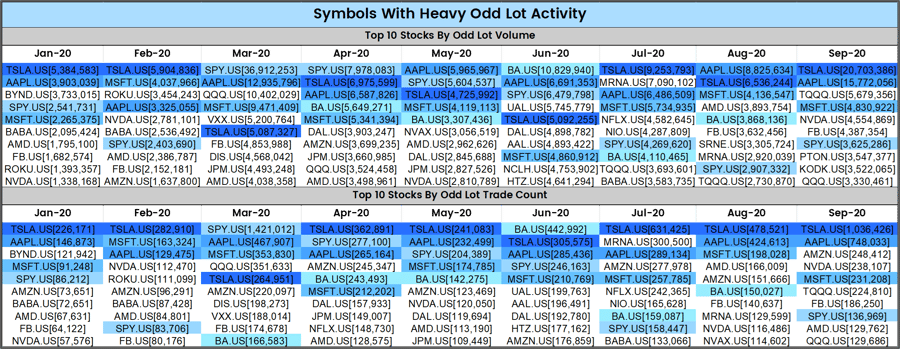
The growth in odd lots has also been attributed to the boom in retail trading. Much of the increase seen in 2019 coincided with retail brokers’ move to zero commission. Looking at names with some of the highest rates of odd lots, many are household names (AAPL, AMZN, MSFT, TSLA). AMZN, in particular, trades in odd lots 91% of the time, with nearly half of its daily volume stemming from odd lots. Before its stock split, TSLA had a similar pattern where odd lots accounted for over 90% of trades and 45% of volume in July and August 2020. These names are heavily weighted in retail brokerage accounts but also popular on the institutional side—perhaps most notably in ETFs—so the sustained growth in odd lot trading suggests retail isn’t the sole driving factor.
Stock Price and Odd Lots
There are some noticeable symbol-specific odd lot trends, with stock price having the strongest correlation. As stock price increases, the frequency it trades in odd lots also increases.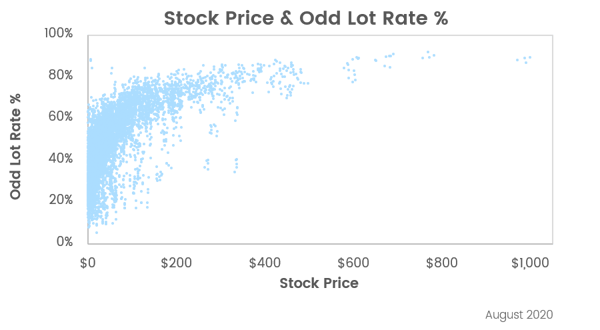
Odd lots not only increase with stock price, but they increase quickly. At $75, odd lots start to pick up and represent roughly 60% of trades.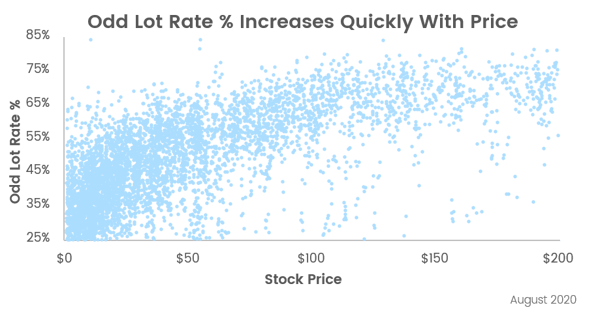 While the correlation between high-priced stocks and odd lots isn’t surprising, it’s worth noting just how rapidly it occurs. There has been a noticeable shift toward higher-priced names over the last few years, which could certainly be one component of the growth in odd lots.
To look at a microcosm of the share price effect, we examined two notable companies that split their stock last summer. While many companies have opposed splitting their stock, both TSLA and AAPL (which appeared several times in the Symbols With Heavy Odd Lot Activity table above) did just that. The 4-1 AAPL split on August 28th and the 5-1 TSLA split on August 31st brought their respective prices down substantially. Given the correlation demonstrated between stock price and odd lots, you would expect odd lot rates to drop post-split. In fact, that’s precisely what we see. Compared to similar stocks (AMZN and MSFT), which did not have splits, we can conclude that the drop in Odd Lot Rate % and Odd Lot Volume % is directly tied to stock price.
Impact Of Stock Split On Odd Lots:


There have been several theories on odd lot growth. Retail activity has been a popular one, but the data we observed doesn’t seem to support that. Algorithmic and schedule-based trading has been another common rationale. This does make some sense as average trade sizes have been shrinking over time. In Q1’21, Clearpool had an average trade size of 172 shares in ping phases and 143 shares in rest phases. The growth and popularity of ETFs have also been attributed to increased odd lot trading volume since create/redeem baskets can require trading in odd lots.
While the cause of the increase in odd lots isn’t clear, the effect is apparent—they have continued to grow. This trend appears unlikely to change as brokers now even offer fractional shares. While fractional shares are created out of inventory, how often brokers combine these fractional shares into a whole share or shares to trade remains to be seen. This could explain the increased retail inventory observed in March 2020, but not the increased odd-lot volume that one might have expected
Conventional wisdom has generally been to put a 100-share minimum on most trades, and most institutional traders will often use that minimum quantity to shield themselves from supposed predatory trading or attempted information gathering. Certain market participants use odd lots to try and expose “hidden demand” without committing significant capital. But is that the best approach given that around 12% of overall market volume and almost half of all trades are odd lots (even more in some popular names)? This leads to the question—should traders find a way to interact with odd lots in their trading strategies safely?
Tactics for Managing Odd Lots in Your Algorithmic Trading
The abundance of odd lot orders in the market is evident, so what can you do to manage how your electronic orders interact with odd lots? Here are a few suggestions on where to start in the AMS:
- Smart MEQ
Instead of relying on a static Minimum Execution Quantity, use “Smart MEQ,” which is dynamically calculated based on stock-specific trade-sized percentiles. This can be beneficial for calculating MEQ for higher-priced stocks with lower average trade sizes and is available in SOR, Dark Agg and I Would Dark.
- Odd Lot Volume Tracking
In the POV strategy, odd lots are included in volume tracking by default. However, you can adjust this setting in the AMS to exclude odd-lot volume if you wish to do so in certain scenarios.
- Odd Lot Slicing
By default, orders in Auction, POV, TWAP, and VWAP are eligible to send odd lot slices for orders of less than 500 shares. Adjust odd lot slicing size in the AMS if you want to specify a different order size that should be eligible to send odd lots. - VWAP Benchmark
Our VWAP benchmark includes odd-lot sales in its calculation, so consider tracking this metric in the AMS. - A/B Testing
One way to ascertain how odd lots impact your trading is to create two versions of the same strategy—where one interacts with odd lots, and the other does not. Set up an A/B test with those two strategies in the AMS and methodically measure the results.
We welcome the opportunity to speak more about this data and consult on customizing your algorithmic trading strategies based on your goals and the names you’re trading. Feel free to contact us to continue the conversation.