
For the first time in 20 years, we witnessed a Level 1 cross-market trading halt on March 9, 2020. It was followed by three more days where the Level 1 market-wide circuit breakers (MWCB) were triggered and the markets halted due to significant market declines with the potential of exhausting market liquidity.
Market-wide circuit breakers are, in effect, a cross-market pause to allow the markets the opportunity to reset from extraordinary market volatility. A cross-market trading halt can be triggered at 3 Levels.
| Trigger Value | Time | Action |
|
MWCB Level 1 |
Before 3:25 pm At or after 3:25 pm |
Halt 15 minutes Trading continues, unless there is a level 3 |
|
MWCB Level 2 |
Before 3:25 pm At or after 3:25 pm |
Halt 15 minutes Trading continues, unless there is a level 3 |
|
MWCB Level 3 |
Anytime |
Halt remainder of the day |
https://www.nasdaqtrader.com/trader.aspx?id=CircuitBreaker
After a Level 1, Level 2, or Level 3 trading halt, a re-opening auction must be held to re-open the market. Re-opening auctions vary by listing exchanges and FINRA.
In this blog post, we analyzed volumes and price movements of the S&P 500 and made the following observations on the below MWCB days.
| Date | Start | End |
| 03/09/2020 | 9:34:13 am | 9:49:13 am |
| 03/`12/2020 | 9:35:44 am | 9:50:44 am |
| 03/16/2020* | 9:30:01 am | 9:45:01 am |
| 03/18/2020 | 12:56:17 pm | 13:11:17 pm |
* It is possible that post-halt opens are marked as openings, not re-openings, if the stock did not open before the halt.
Observation 1: Limited Participation in Re-Opening Auctions
We observed fairly low participation rates in the re-opening auctions, which likely has a direct impact on the effectiveness of the auction’s function of price discovery.
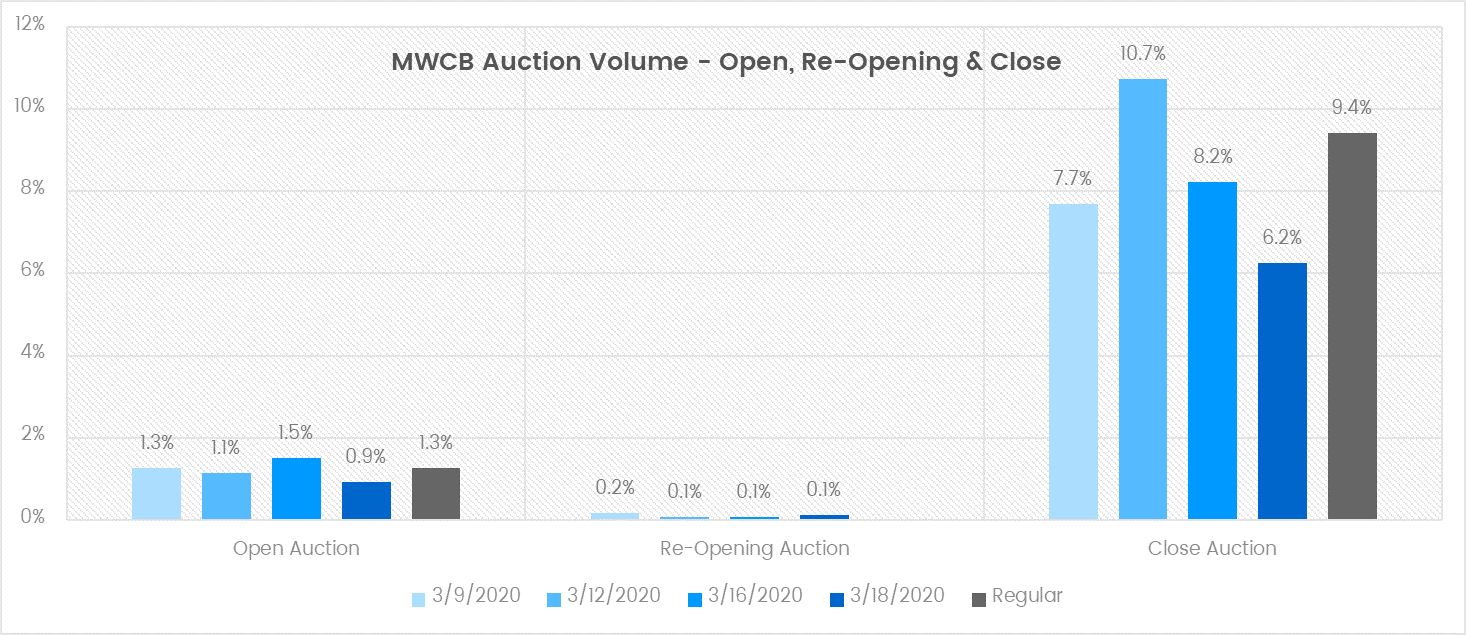
Re-Opening Auction Volume Observations
- On the days of the halt, opening auctions had similar volumes compared to regular trading day volumes.
- However, as compared to regular trading day volumes, the re-opening auctions after the halt had significantly less volume than the opening auction market volumes.
Re-Opening Auction Volume Hypothesis
- We presume broker algorithms may not be optimized to participate in re-opening auctions, attributing to the low participation rates.
- Since auctions are a key form of price discovery, the lack of participation in the re-opening auction will likely have an impact on the continuous market once the auction completes.
- Participation may also be low in the re-opening due to traders being cautious, rather than not being able to access the auction.
Observation 2: Volume After the Re-Opening Increased
Measuring 5-minute intervals pre and post triggering of the MWCB, we observed increased volumes after the halt was lifted.
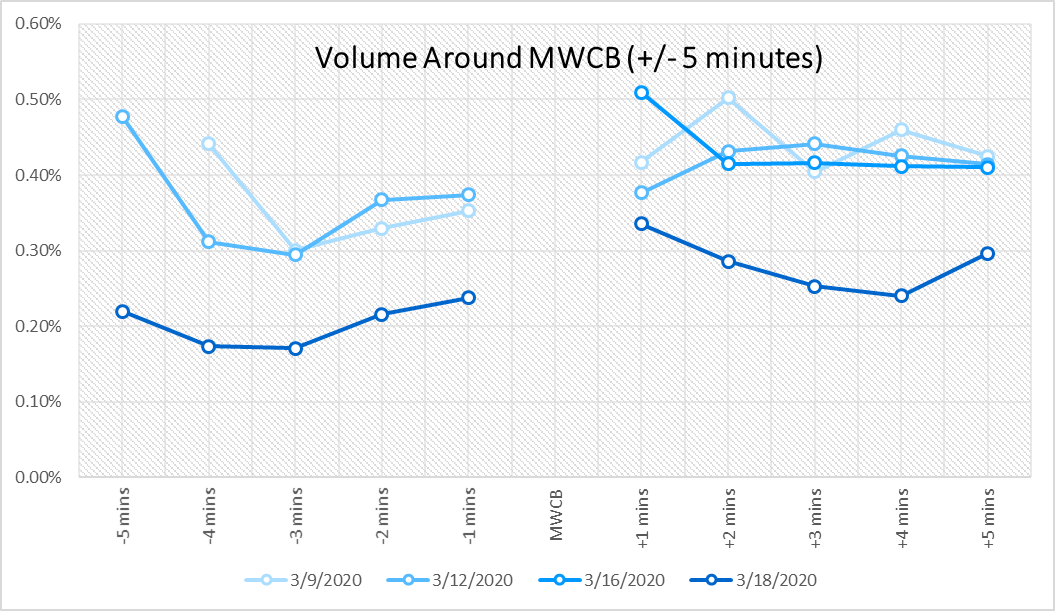
| Volume around MWCB | 03/09/20 | 03/12/20 | 03/16/20 | 03/18/20 |
| -5 minutes | 0.48% | 0.22% | ||
| -4 minutes | 0.44% | 0.31% | 0.17% | |
| -3 minutes | 0.30% | 0.29% | 0.17% | |
| -2 minutes | 0.33% | 0.37% | 0.22% | |
| -1 minute | 0.35% | 0.37% | 0.24% | |
| MWCB | ||||
| +1 minute | 0.42% | 0.38% | 0.51% | 0.34% |
| +2 minutes | 0.50% | 0.43% | 0.41% | 0.29% |
| +3 minutes | 0.40% | 0.44% | 0.42% | 0.25% |
| +4 minutes | 0.46% | 0.43% | 0.41% | 0.24% |
| +5 minutes | 0.42% | 0.41% | 0.41% | 0.30% |
Post Halt Observations
- Immediately after trading resumed, within the 1st minute of trading after the re-opening, we observed increased trading volumes, except for on 3/16/20, where the MWCB was triggered immediately at the open.
- On a normal trading day, we found that volume in the 1st minute of trading after the open (9:30 am – 9:31 am) was about 40% of opening auction volume.
- However, on the MWCB day, we saw that volume in the 1st minute after the re-opening was 200-500% compared to the re-opening auction volume.
Post Halt Hypothesis
- Due to the lack of participation in the re-opening auction, once stocks have re-opened, the trading volumes are significantly higher than when compared to the 1st minute of trading after a typical opening auction.
- This lack of participation in the re-opening will likely lead to a lack of price-discovery, resulting in significant price moves in the continuous market immediately following the re-opening auction.
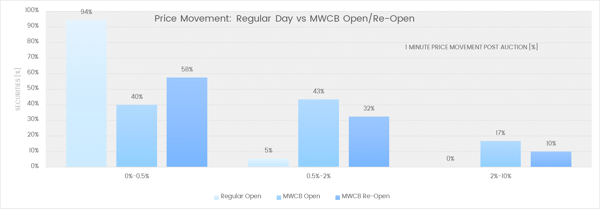
Re-Opening Price Movement Observations
- When compared to a regular open, where markets were less volatile, the MWCB open and re-open displayed significant price movements.
- Price movements in the 0.5%-2% and 2-10% buckets were strikingly different when comparing the regular open to the MWCB open and re-open.
- Particularly in the 2-10% bucket, where the regular open has 0% movement, 10% of stocks in the MWCB re-open had price movement.
Post Re-Opening Price Movement Hypothesis
- The lack of participation in the re-opening auction implies that there is likely less re-opening stabilization, resulting in the price moves post re-opening due to the potential lack of price discovery.
- The movement in the 2-10% bucket of stocks in the re-open could be due to the lack of participation, which did not give the market the opportunity to stabilize.
Observation 3: VWAPs are Likely to Miss
VWAPs rely on historical volume curves to create schedules. On MWCB days, we observed a volume curve that significantly diverged from the historical volume curve.
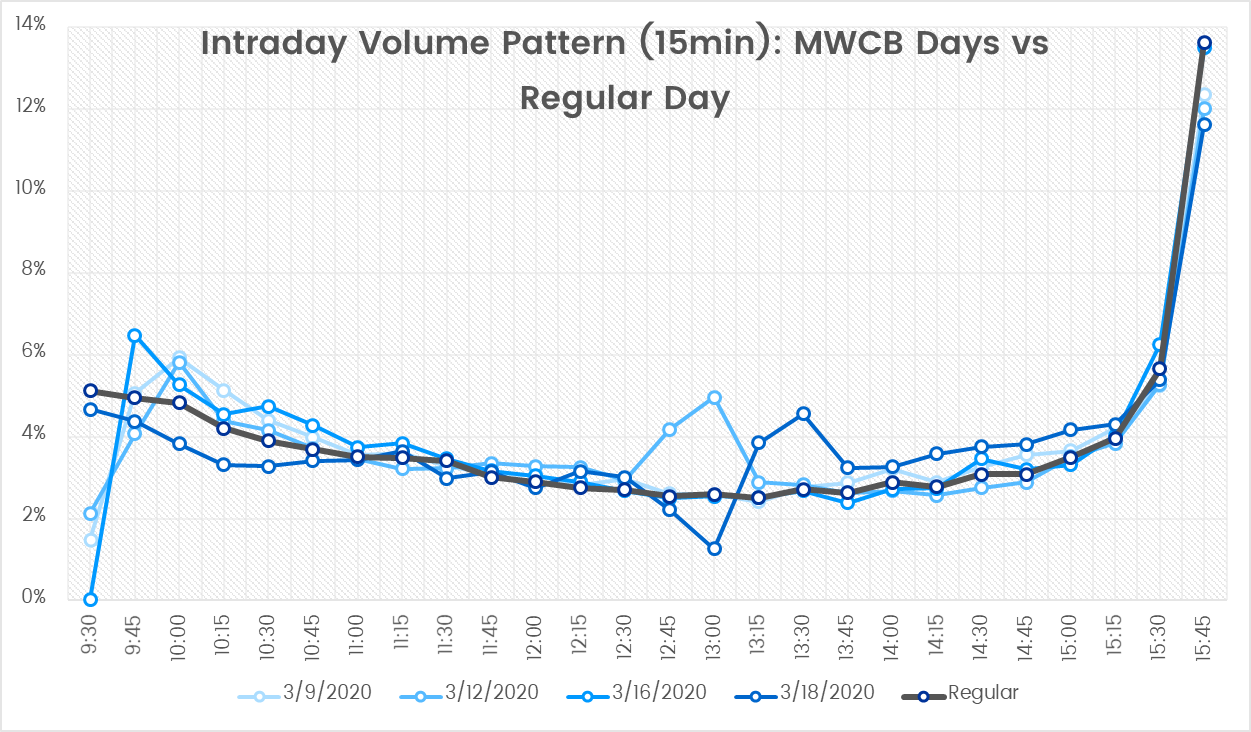
VWAP Volume Observations
- On MWCB days, we observed a significant distortion in volume patterns as compared to regular days.
- We found that during the last 30 minutes leading into the close, volumes were similar to regular trading days.
- We attribute the increased volume around 1:00 EST on 3/12 to a special FOMC meeting.
VWAP Volume Hypothesis
The increased volatility on MWCB days distorts the volume curve when compared to historical volume curves, possibly impacting VWAP performance or performance of other algorithms that rely on historical volume data.
Conclusion
While it took 20 years to trigger the MWCB, in those few short days, there were several learnings to ensure we are more prepared the next time it happens. We are not the only ones taking the time to reflect. A recent WSJ article, Wall Street Explores Changes to Circuit Breakers After Coronavirus Crash, states that a few financial firms are reviewing how circuit breakers worked during the sell-off and are identifying possible improvements to the SEC.
We plan to continue to monitor the potential impact of any recommendations and use these findings to make improvements to our algorithms.